December 3, 2019
My experience in developing algorithms for over two decades taught me that many people tend to use complex methods even if a problem can be solved more effectively with a simple approach. Unfortunately simple and elegant solutions often require more time to be discovered.
During the last one or two years a lot of new Bitcoin indicators were published, which are based on price as well as fundamental blockchain metrics. It seems that many people overlooked that it is possible to create indicators, which can be just as effective, with price data alone. Only if there is no way to extract more trend information from price should we think of adding more complex fundamental data.
The BEAM indicator that is proposed here is at least on par with indicators based on blockchain metrics and requires less additional data. BEAM helps identifying promising times during a cycle for buying and selling Bitcoin or other crypto currencies. It was designed to be as clear as possible and avoid misinterpretation. For more information about Bitcoin cycles, which are the basis of BEAM, read my article about Contrarian and Anti-Cyclical Investment in Bitcoin.
.BEAM stands for "Bitcoin Economics Adaptive Multiple" and is the result of experimenting with various indicator types and formulas for almost 2 years. Various other designs were dropped or improved until reaching a satisfying result.
BEAM may look like a typical indicator, but can also be used as a basis for an anti-cyclical investment plan for Bitcoin as well as other crypto assets whose cycle is tied to that of Bitcoin. Roughly speaking, BEAM divides the price of bitcoin at any given moment to a moving average of past prices. This makes price trends more clearly visible.

For people with some mathematical understanding, here is the BEAM formula in a C-like syntax:
BEAM = log( Price(n) / MA( min(n,CycleLength) ) ) / AssetDivisor
BEAM = log( Price(n) / MA( min(n,1400) ) ) / 2.5
Price or Price(n) is the price at the point in time that BEAM is calculated for. n runs from day 1 that a price existed to today’s price, with n going up to more than 3600 for 10 years of Bitcoin price history.
The basis of BEAM is a moving average (MA), which averages all previous prices for a certain period of time. For CycleLength we have to substitute 200 weeks or 1400 days as this is the average cycle length of Bitcoin (if we exclude the first atypical cycle). As we also want to have values for the first 1400 days, we have to gradually increase the Cycle Length value from 1 to 1400, which is expressed by min(n,1400). This takes care of the first, shorter cycle.
Then we have the AssetDivisor, 2.5 for Bitcoin, which makes sure that the BEAM values are roughly within a 0 to 1.0 range. Negative as well as values above 1.0 are possible, though.
Finally, the logarithm (log) avoids that the BEAM values crawl at the bottom near 0.0. So the logarithm scales up lower values for a more even value distribution and avoids sharp spikes near ATHs. This is necessary, because the 1400 days MA runs below all prices and dividing it by the price produces mostly values near 0.0.
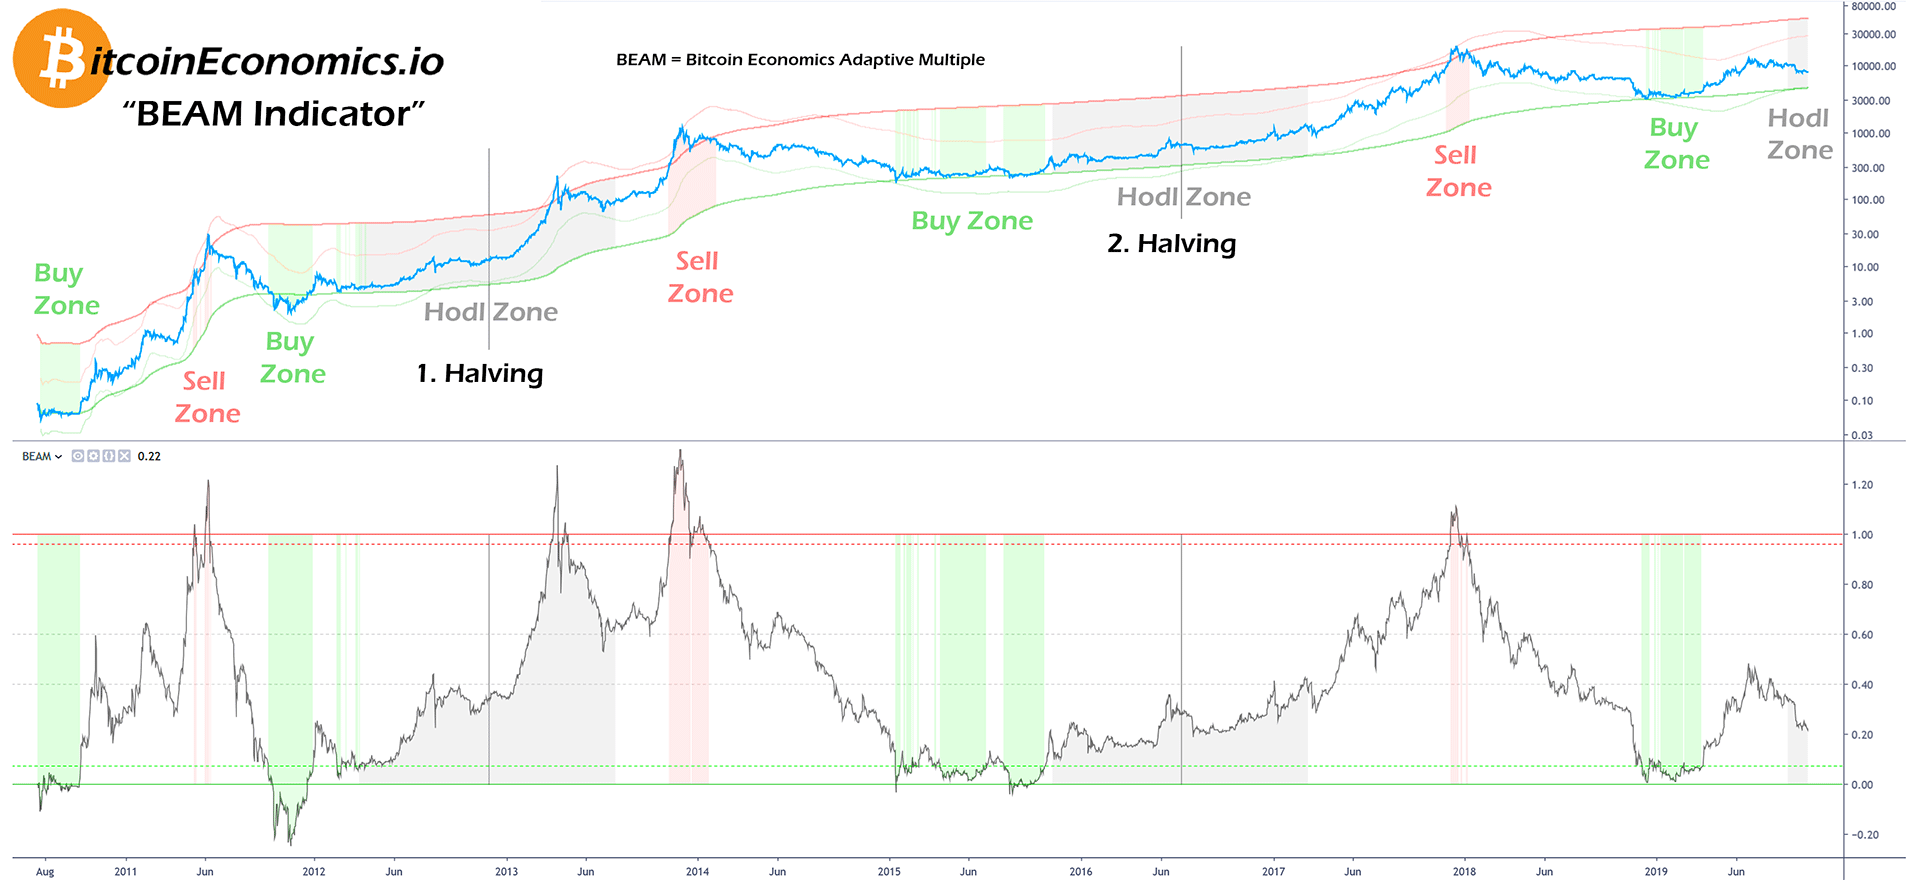
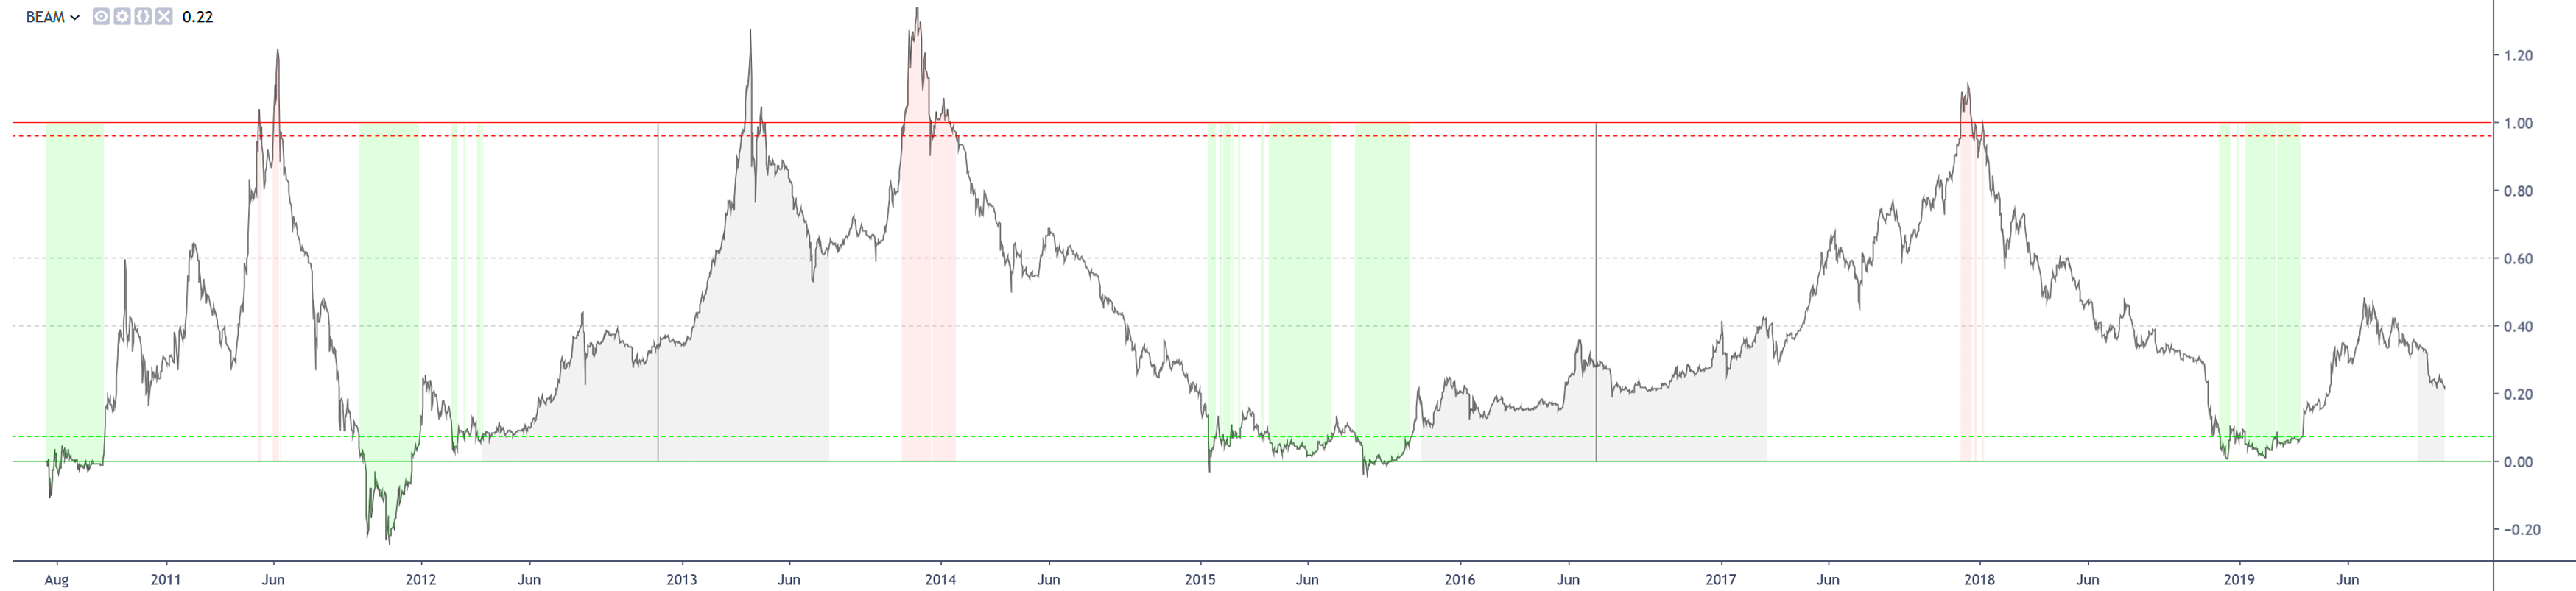
A BEAM value near zero or below indicates that Bitcoin (or another asset) is underpriced or oversold and means that buying might be a good idea. A value near 1.0 or above means that the asset is overpriced or overbought and selling is recommended.
For further assistance there are three types of zones. A green buy zone indicates that it would be wise to buy Bitcoin. A red sell zone makes clear that selling Bitcoin might be a good idea. A gray hodl zone signals that it is advisable to keep on holding Bitcoin even if the price already seems rather high. At the start of the hodl zone there is usually also a new buying opportunity.
The green zone is entered once BEAM reaches a value of 0.07 and stays lower. A gray hodl zone begins 8 months before each halving and ends 8 months afterwards. A red sell zone exists for a BEAM value of 0.96 and higher.
Green Buy Zone = BEAM <= 0.07
Gray Hodl Zone = n > Halving – 240 days && n < Halving + 240 days
Red Sell Zone = BEAM >= 0.96
These values were chosen to produce a relatively high profit in accordance with past BEAM values. Everyone should feel free to lower these thresholds according to his investment plan or risk sensitivity. Increasing the thresholds does not seem wise as it risks missing buying and selling points.
Buy and sell zones extended over several weeks in the past, so it is best to buy and sell multiple times, e.g. each week, to achieve a good average price.
The gray hodl zone was mainly introduced to avoid selling on extreme dips as the 75% dip in April 2013, which could easily have been misinterpreted as a crash into a bear market. In hindsight the crash was however too close in time to the first halving. It cannot be excluded that such a sharp drop initiates a bear market in future, but the gray hodl zone at least provides some food for thought.
As you can see on the right-hand side of the chart, we entered a new hodl zone with the third halving upcoming in May 2020. Because of the 50% drop from June to November 2019 this phase is termed reaccumulation. There were reaccumulation phases at each start of the hodl zone in the past when price dropped again after a peak. The green buy zones are initial accumulation phases. Reaccumulation usually provides a second chance for late-comers to buy at somewhat higher prices.
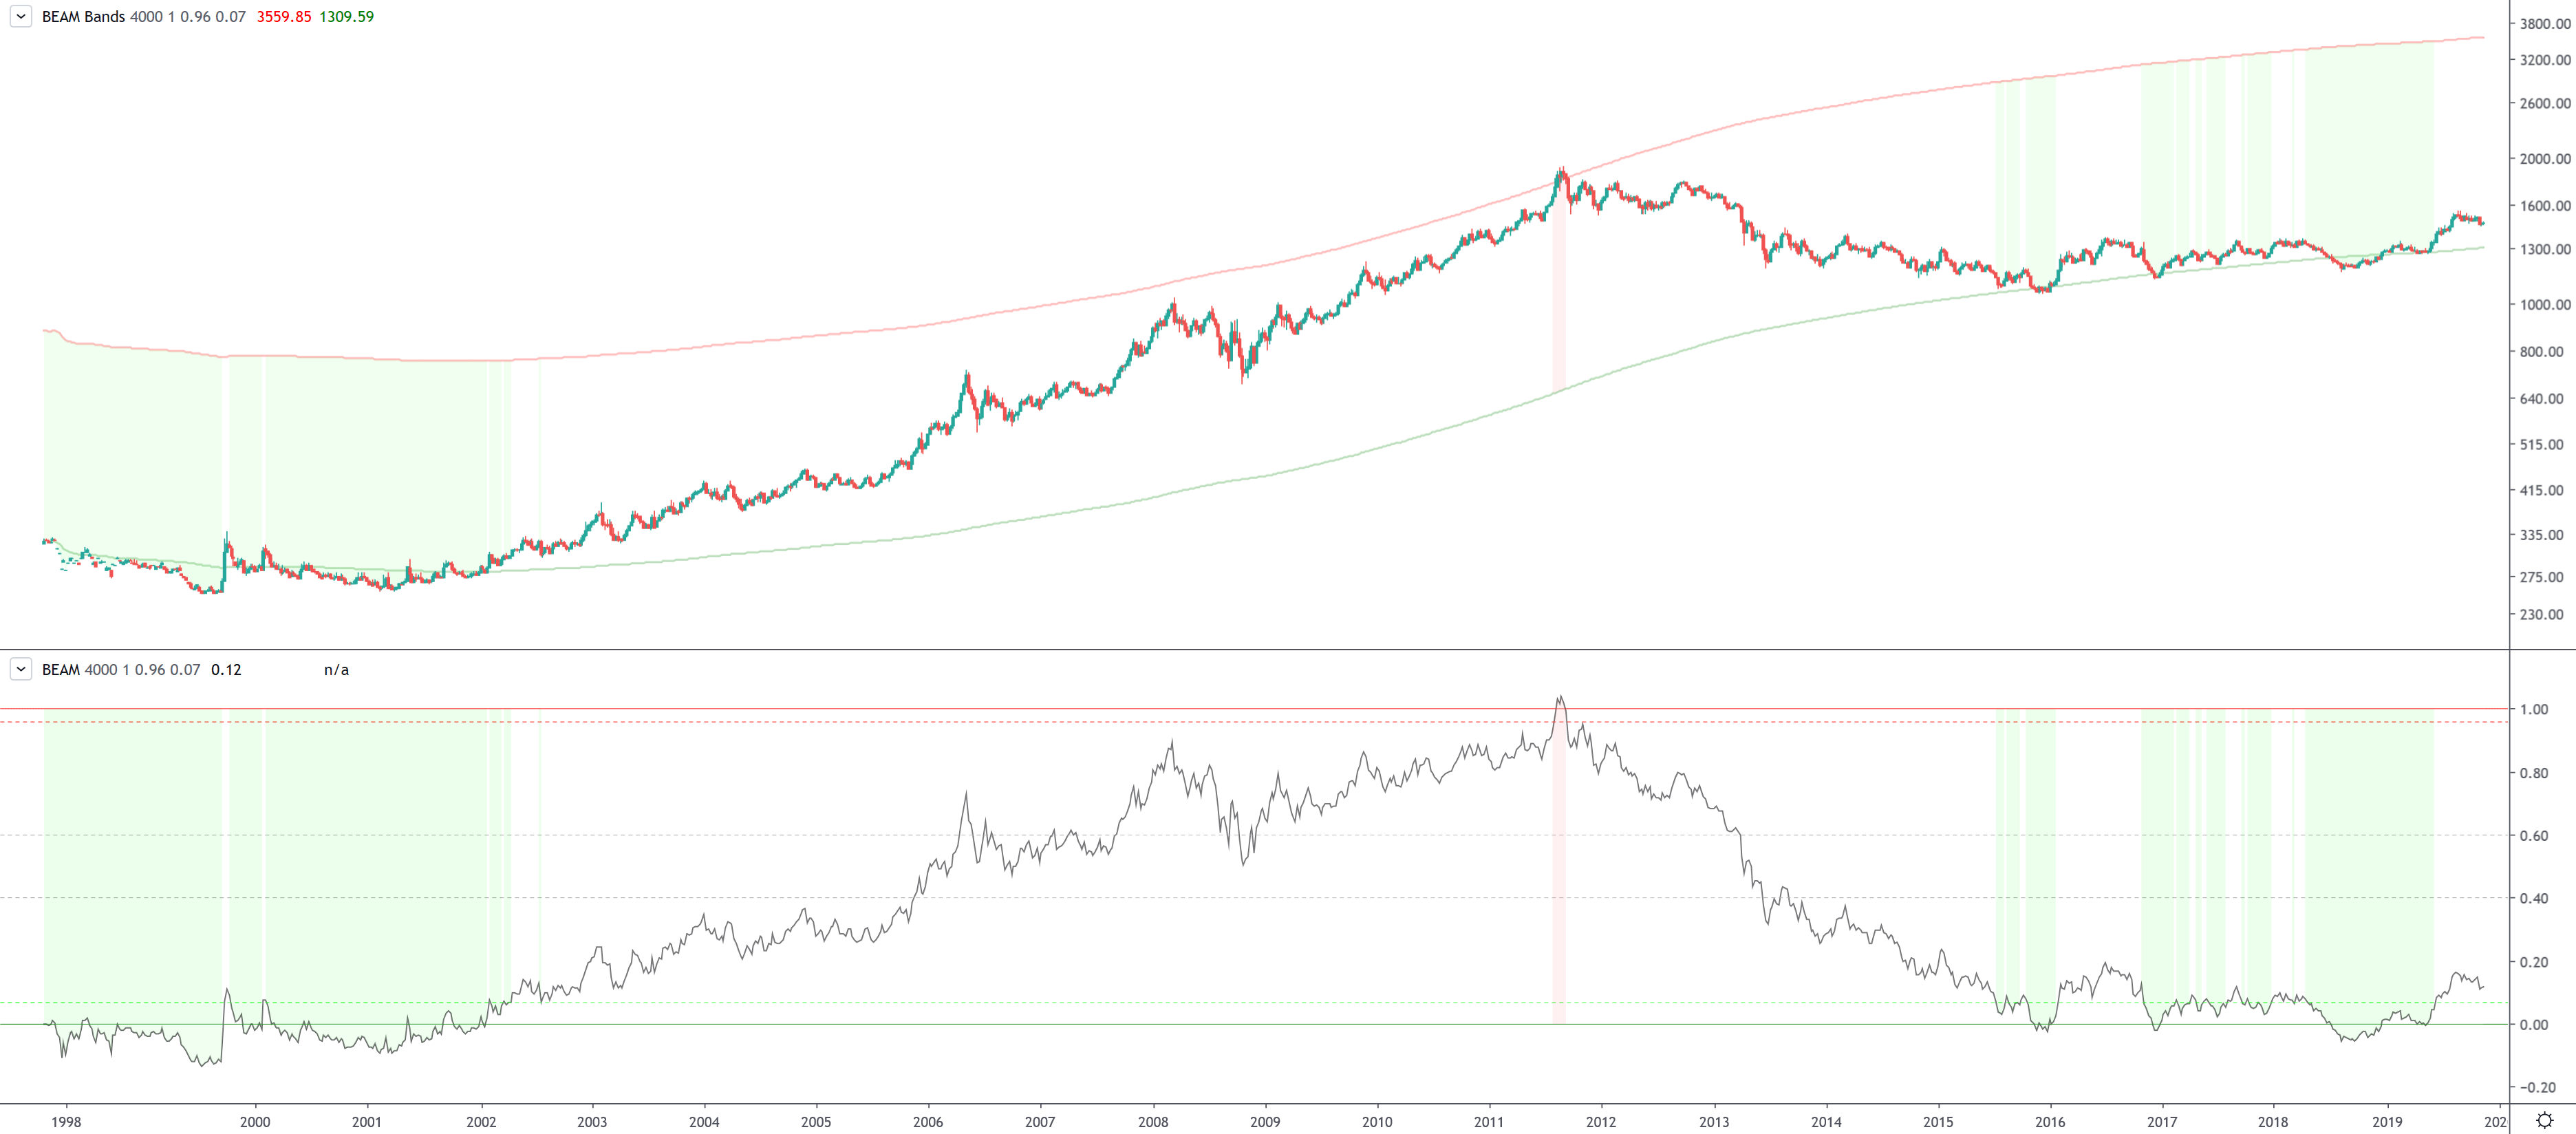
BEAM Bands is a version of the BEAM indictor that is drawn directly on the price chart. It is a more visual representation of BEAM and lets you compare it directly to the price. On the other hand, you still have to look at the original BEAM indicator to see the BEAM value.
BEAM Bands consists of a upper and a lower line, which represent the 0.0 and 1.0 values of the BEAM indicator projected on a price chart. So the two lines are of course not straight but follow the price curve.
Here is how to calculate BEAM Bands:
Lower Line = MA( min(n, CycleLength) )
Upper Line = MA( min(n, CycleLength) ) * exp(AssetDivisor)
Lower Line = MA( min(n, 1400) )
Upper Line = MA( min(n, 1400) ) * 12.182494
We already know MA( min(n,1400) ) from the BEAM formula. It is the basis for calculating the BEAM indicator, which is now visible as a curvy line on the price chart. The upper BEAM line is the same formula multiplied by the exponential of AssetDivisor, which is exp(2.5) = 12.182494 for Bitcoin.
The three BEAM Zones are also displayed together with the lines of BEAM Bands and are calculated as described above.
The upper and lower lines of BEAM Bands can also be used for predicting future prices. A minimum future ATH price is indicated by the upper line and a future price bottom is predicted by the lower line.
The lower line can be seen as a minimum price for Bitcoin. It becomes more reliable for predicting the next higher bottom once a new ATH was reached. It is currently at $4900. As a new bull market already started it is unlikely that the price of Bitcoin will touch it again. The future price bottom will likely be much higher. Theoretically the price bottom is determined by the cost of producing new bitcoins, which rises with increasing competition among miners and is expressed by the hash rate and difficulty measure.
The minimum ATH price prediction indicated by the upper line of BEAM Bands is at $60,000 at the moment. When looking at the past, the minimum ATH value at the start of a bull market always increased further until the ATH. This does not necessarily have to be the case this time, but it is likely. A rough interpolation with $40k one year ago and $60k today would indicate a price of $100k in two years. Nevertheless $60k would already be a dream come true for many Bitcoin hodlers. Having a potential selling price for Bitcoin can help determining how much to invest. If you have a lower price target, there is a bigger chance that you might be taken by surprise.
As both lines have been a good predictor for 10 years of price history, they appear to be rather reliable for future price predictions - provided that the structure of the Bitcoin market as well as its participants do not change fundamentally.
I developed BEAM in Pine Script on Tradingview.com. Recently I published “BEAM” and “BEAM Bands” there. So at Tradingview.com you can apply them to charts by clicking the Indicators button and searching for them. To apply them to Bitcoin I recommend that you enter “BNC:BLX” for displaying the “BreaveNewCoin Liquid Index for Bitcoin” chart and set the time frame to 1 day. The BLX chart shows all historical Bitcoin prices since mid 2010.
You can adjust the BEAM as well as BEAM Bands parameters by clicking on its cog icon. There you can adjust the cycle length, asset divisor as well as the two thresholds from the formulas above. For non-crypto assets you can deactivate the Halving check box, which makes the halving lines and the hodl zones disappear.
You can also check out BEAM without a TradingView account by using this link: Tradingview BEAM Chart, or the BEAM link in the navigation bar at the top. Click on BTCUSD on the right to get the most current BEAM value.
BEAM also works with other crypto currencies that are at least 3-4 years old, because they are highly correlated with Bitcoin itself and follow Bitcoin’s cycle. The future will show if BEAM also works fine with crypto currencies from 2017 and later. At the moment they linger near or below a BEAM value of zero throughout the chart.
When applying BEAM to Ethereum, XRP, Litecoin or other crypto assets it is not necessary to change any parameter. You can see the same false signal, which Bitcoin exhibited in spring 2013, in mid 2017 for many altcoins. One solution to avoid it would be to extend the hodl zone from 8 to 16 months after the halving. A better idea is to compare the BEAM values of Bitcoin and altcoins and only use it as a signal if both come near 1.0 at the same time.
BEAM shows extremely long buy zones for altcoins like XRP, Litecoin and Stellar. This is because these coins have a rather flat price curve and only seem to wake up near the end of each bull market and achieved extraordinary gains in a very short period of time.
BEAM also works very well with Gold and Silver, provided that the cycle length is adjusted to 4000 days and the asset divisor to 1 or 1.25. But the cycles of these monetary metals are 3-8 times longer than that of cryptos, so you need much more patience.
BEAM is not suited for stock indices like the Dow Jones or S&P 500. It only manages to catch tops in 1881, 1901, 1936, 1946, 1955 and 1987, but it reacts too soon in 1927 and 1998. It misses several ATHs, especially in 1973 and 2007. Moving averages do not work so well for stocks, so BEAM is not the right indicator for them.
Hopefully BEAM will be useful when pondering about Bitcoin sell and buy decisions. It was intentionally created to be easy to interpret even by beginners. But that does not mean that you should trust it blindly.
BEAM is only a tool and has no absolute predicting power. There is no 100% guarantee that it will still work in future. Indicators and models can only be constructed retroactive. As the future is not fixed, they always fail to work after some time.
The BEAM indicator works fine for the past three cycles. It may either work for 2-3 more cycles, this cycle only or even completely fail in future. If this fourth Bitcoin cycle is atypical again, BEAM may not be able to point out the next ATH precisely, but may start to work again with newer more typical cycles. The next ATH might also be between 0.75 to 0.95 on the BEAM scale. So you have to take this into consideration.
There is uncertainty if the halvings will still be right in the middle of bull markets in future. It only happened two times yet, which is not statistically significant. As the halvings have less and less effect on supply in absolute numbers, they may have no impact on cycles anymore at some point. There is still a good chance that this cycle will be 4 years long and BEAM's hodl zone still has a meaning.
Short-term indicators have the tendency of failure the more popular they get. Long-term models have a chance to become self-fulfilling prophecies the more they are known. As BEAM aims at rather long time frames, 1400 days or almost 4 years, it mirrors fundamental market processes. The 1400 days cycle length of BEAM is robust enough to deal even with a 5 to 8 year long Bitcoin cycle.
I am quite am confident that it will continue to work reliably to a certain degree in future. The only thing that would invalidate it in the future would be the absence of manic final bull runs as we have seen at least three times in Bitcoin's ten year history. If such a fundamental change should occur in Bitcoin or another market, BEAM's AssetDivisor parameter would have to be adjusted.
The BEAM indicator is not meant to be used to make buy or sell decisions on its own. It should be used as one tool among many in a big arsenal of indicators and other types of signals as mentioned in the article Contrarian and Anti-Cyclical Investment in Bitcoin. This reduces the risk of making expensive mistakes.
BEAM looks similar to the MRVR(-Z) and VWAPR indicators, which utilize fundamental blockchain metrics. Extending BEAM with fundamental data, e.g. users, addresses, difficulty, hash rate, supply, volume, realized price or other metrics, may make it even more effective in future. But it might also make sense to incorporate such data in a new model if it does not fit within the BEAM framework.
I hope that BEAM will inspire some developers to rethink their indicators and improve them further.
And I also hope that BEAM will be helpful for people who have problems understanding other indicators, which require more knowledge and interpretation.
Disclaimer: This is not financial advice. For educational purposes only. Do your own research.