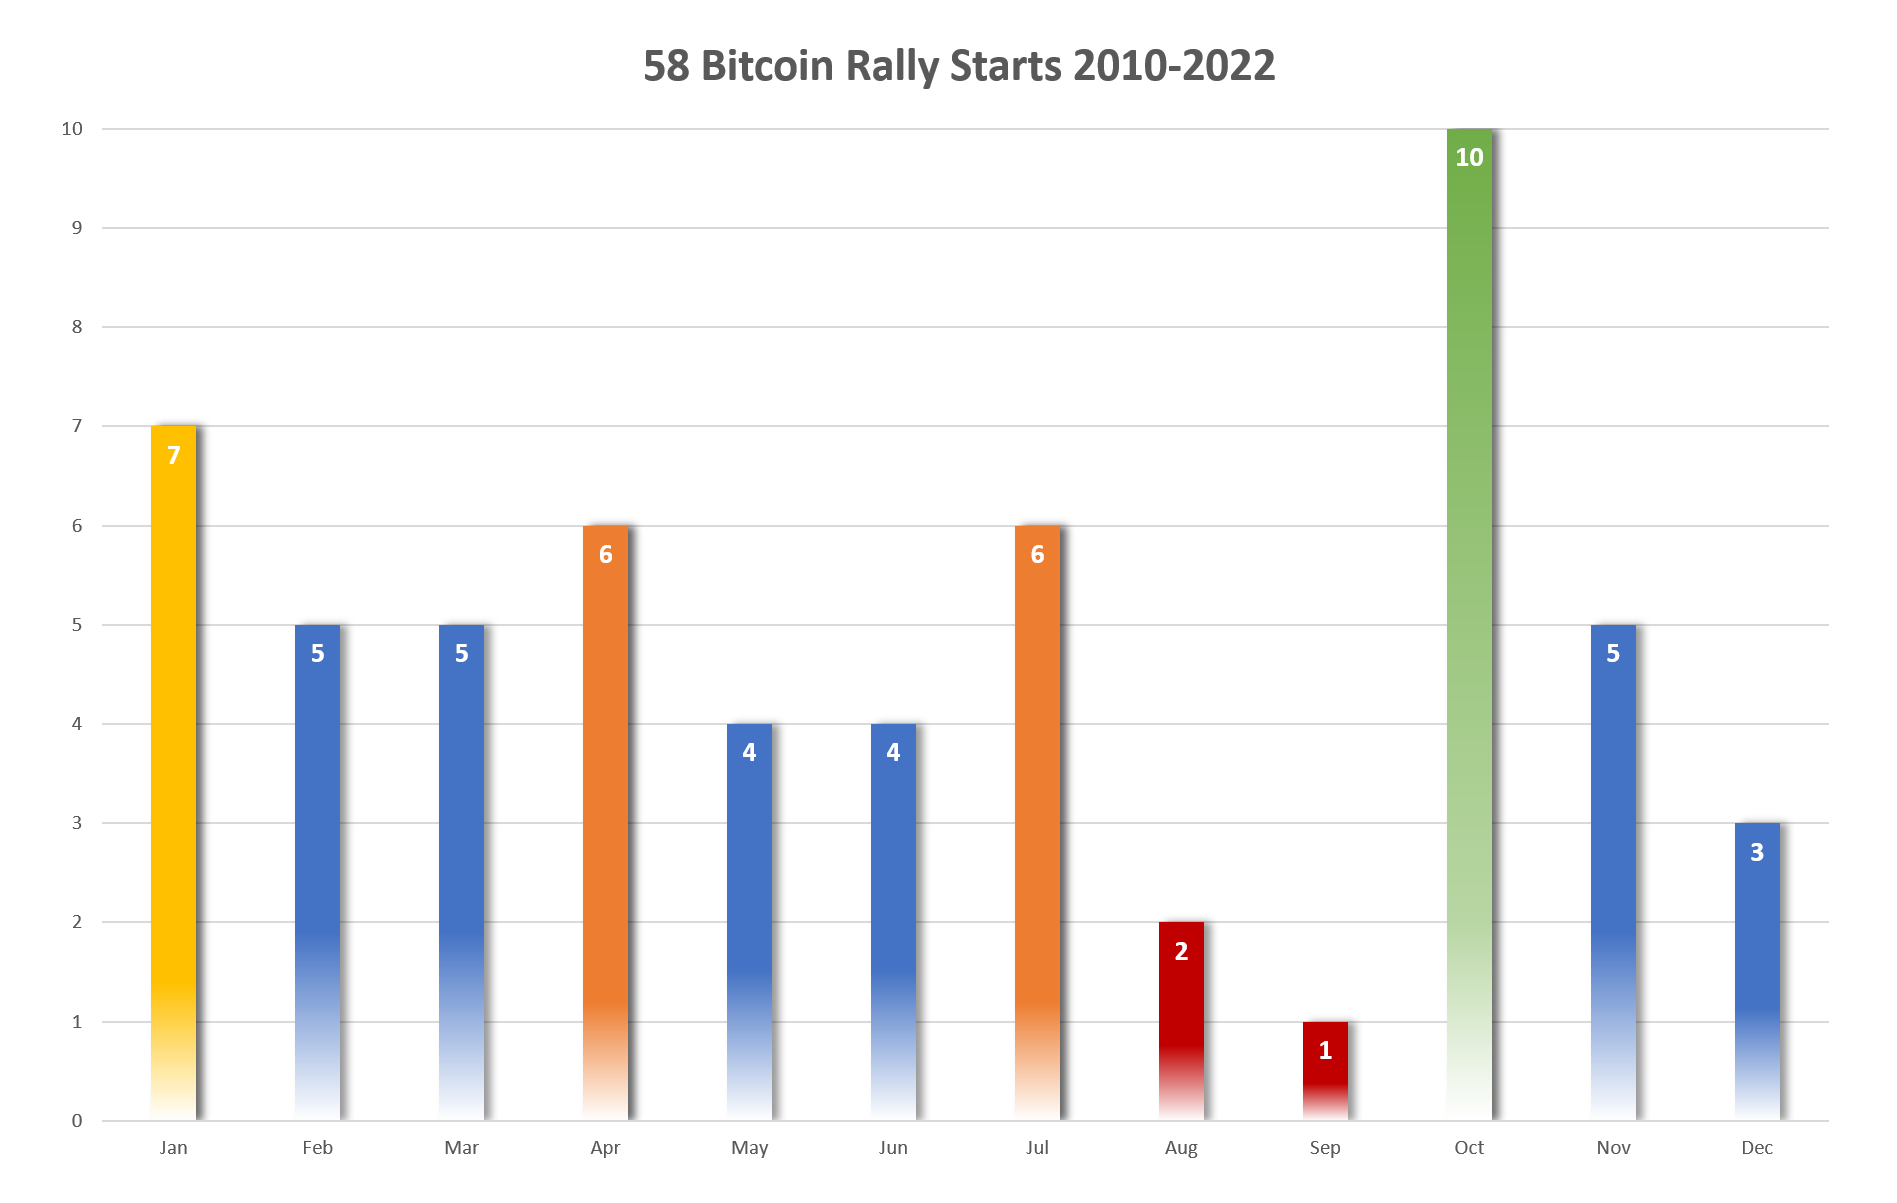
Bitcoin rallies most likely start in October. October has a 83% probability of starting a new Bitcoin rally. Out of 12 years a rally started in 10 years.
The next best month, January, has a probability of only 53%. Other good points are around April and July. Practically every 3 months. Bitcoin rallies as good as never start in August or September.
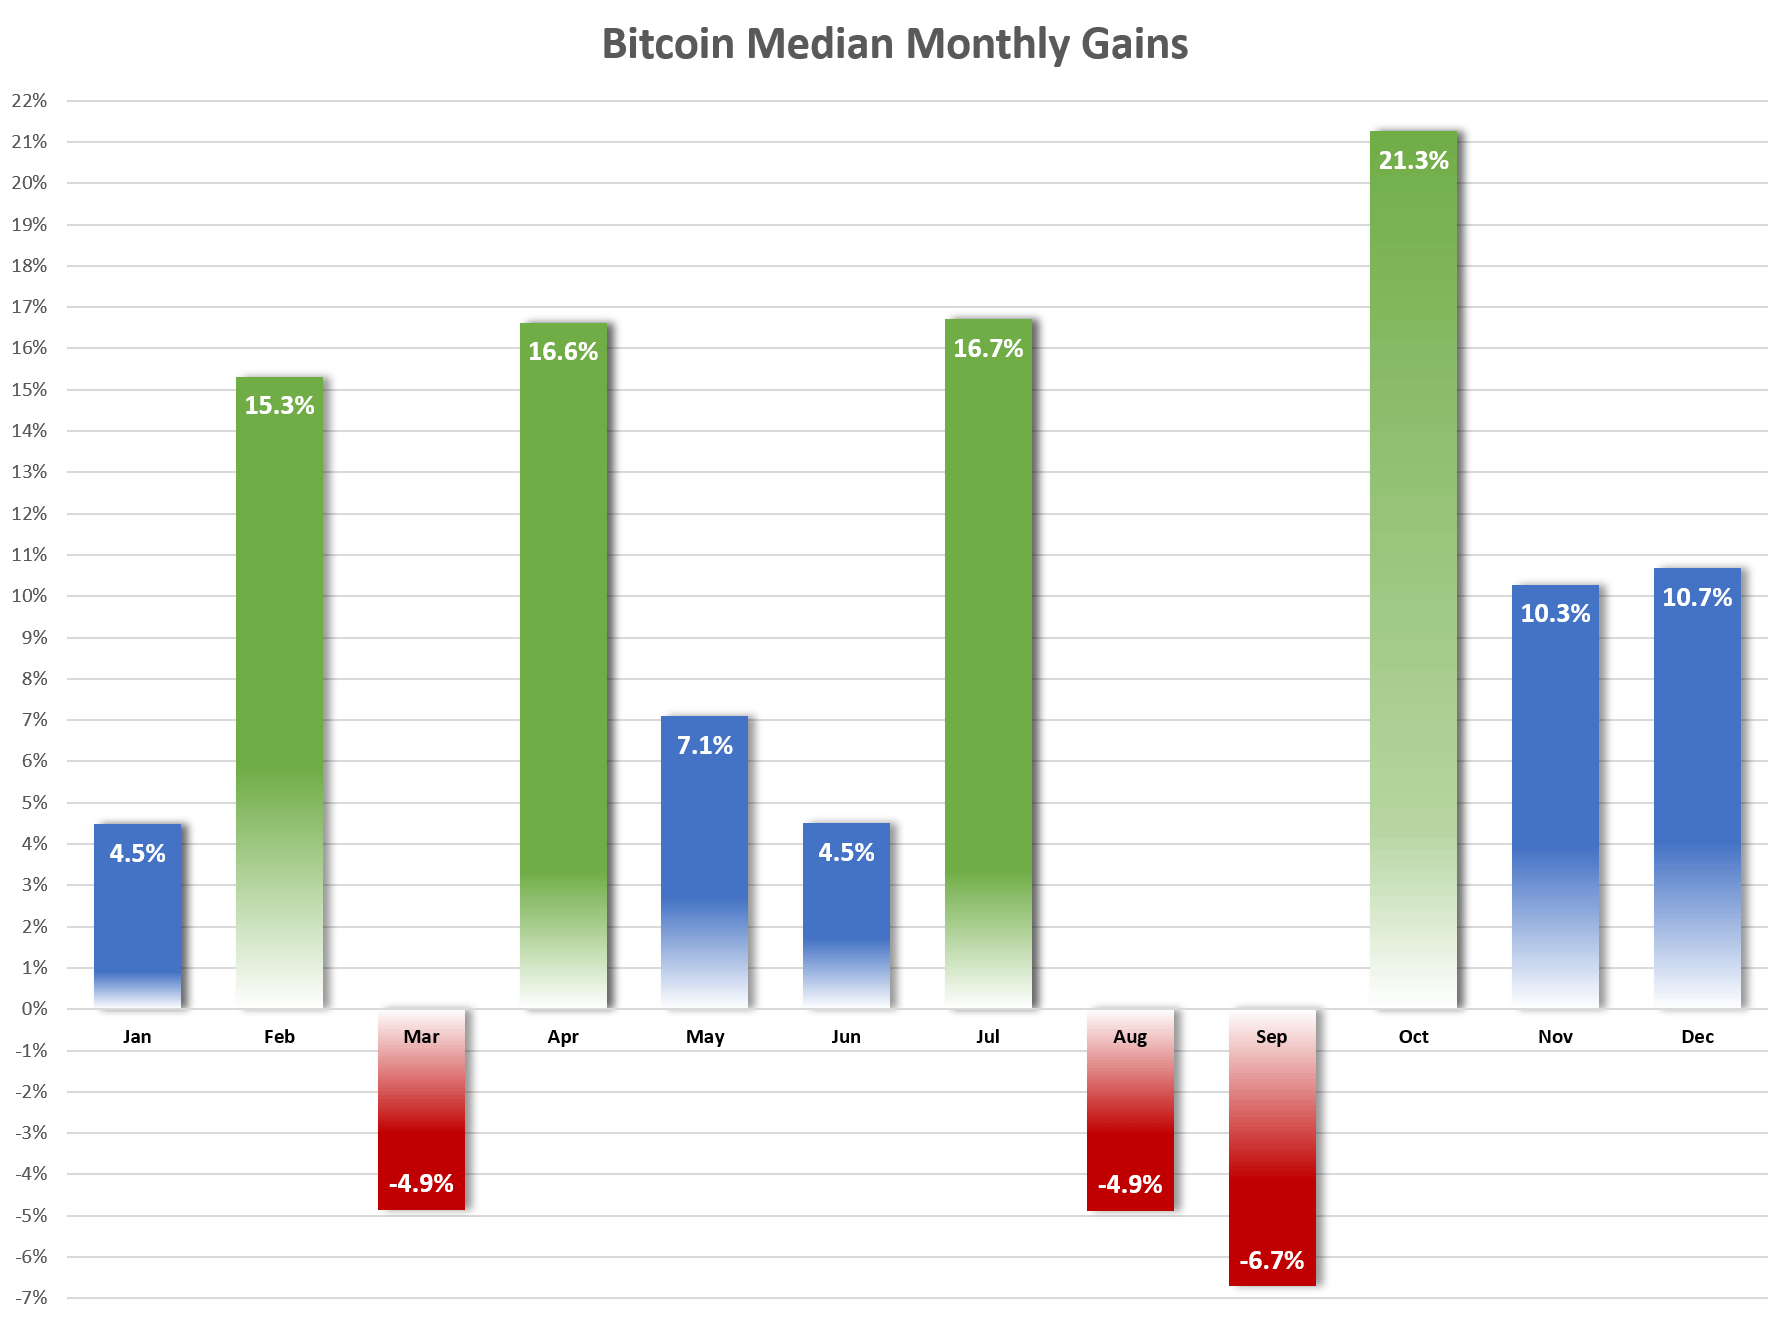
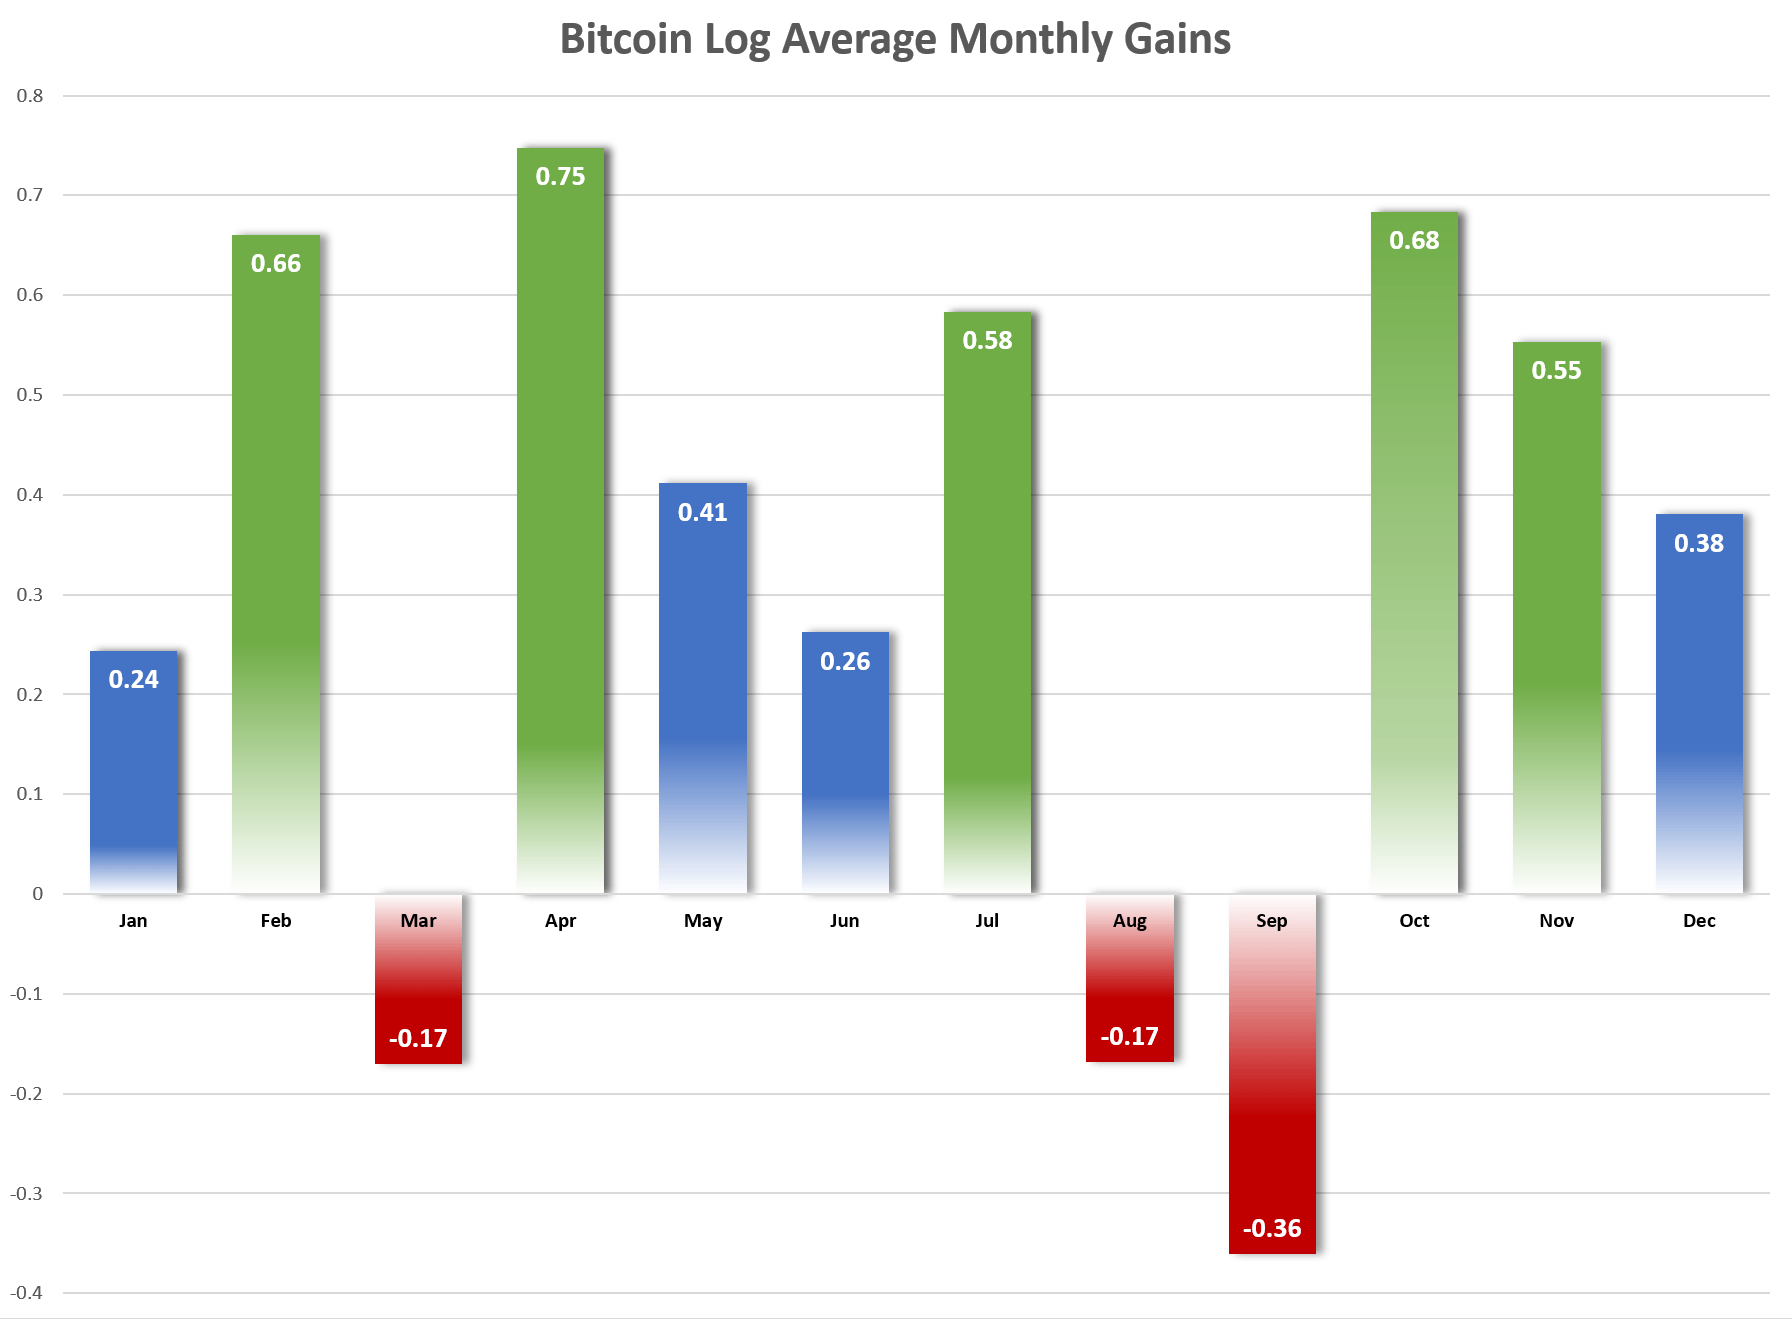
Highest monthly Bitcoin gains occur in Feb, Apr, Jul and Oct/Nov. Lowest gains in Mar, Aug and Sep.
Average monthly gains are misleading because of huge values in 2010-2013. So median and log average monthly gains are shown here, which paint a clearer picture. They are also more in line with the Bitcoin Rally Starts.
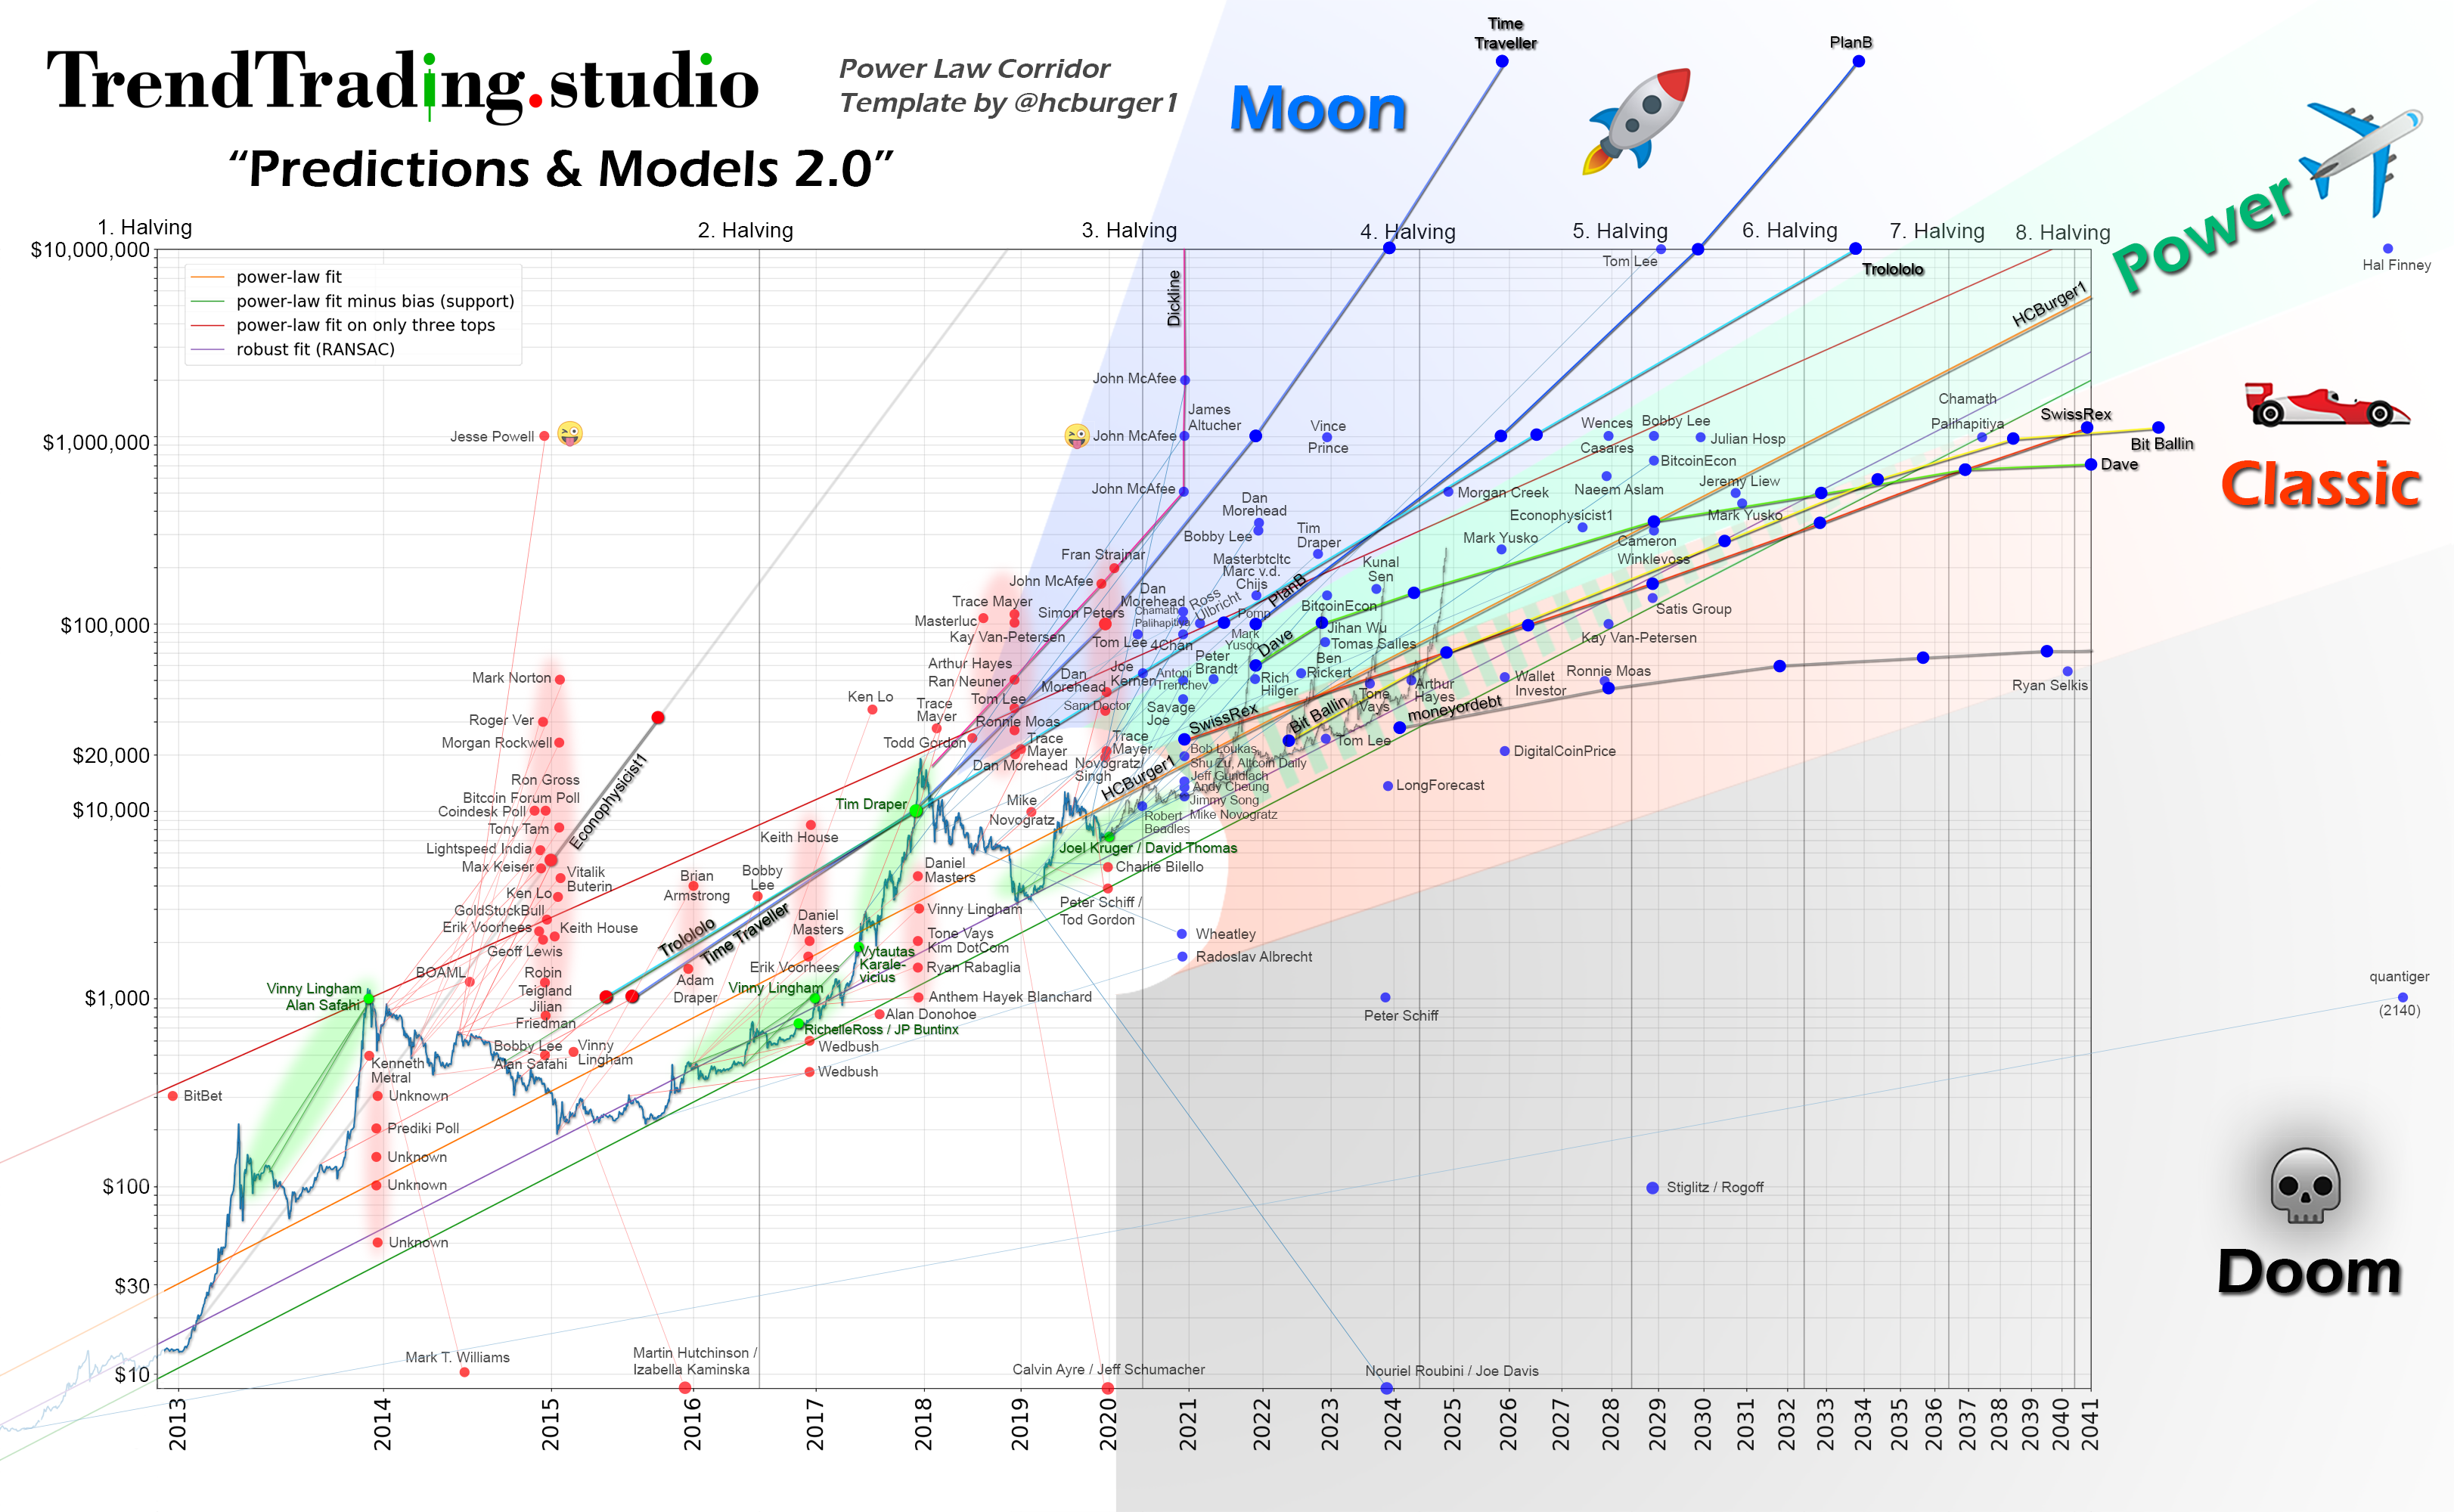
Predictions & Models 2.0:
Conclusions from this chart:
Trend-chasing bias strongly influences BTC price predictions and the development of price models. Trend-chasing bias makes investors chase past performance in the mistaken belief that history predicts future performance. It is why most people start investing near Bitcoin ATHs.
There is a pattern in how most Bitcoin predictions are wrong. But can this pattern can be used to create one good forecast from many wrong ones? Richard Thaler established that "people depart from rationality in consistent ways, so their behavior can still be anticipated and modeled".
How to Make Wrong Bitcoin Predictions:
Rule 1: If price went up like crazy the last 9 month, project the same increase 12 months into the future.
Rule 2: If Rule 1 did not work out, move the predicted number one year into the future. Repeat Rule 2 until Rule 1 is valid again.
How to Make Correct Bitcoin Predictions:
Rule 1: If price went up like crazy in the last 4-5 months, project the same increase 4-5 months into the future.
Rule 2: Copy the 3-4 year prediction of a power law model. Maybe adjust it a bit downwards to be safe.
Rule 3: After a bear market project a similar growth as at the start of a previous cycle 6-12 months into the future.
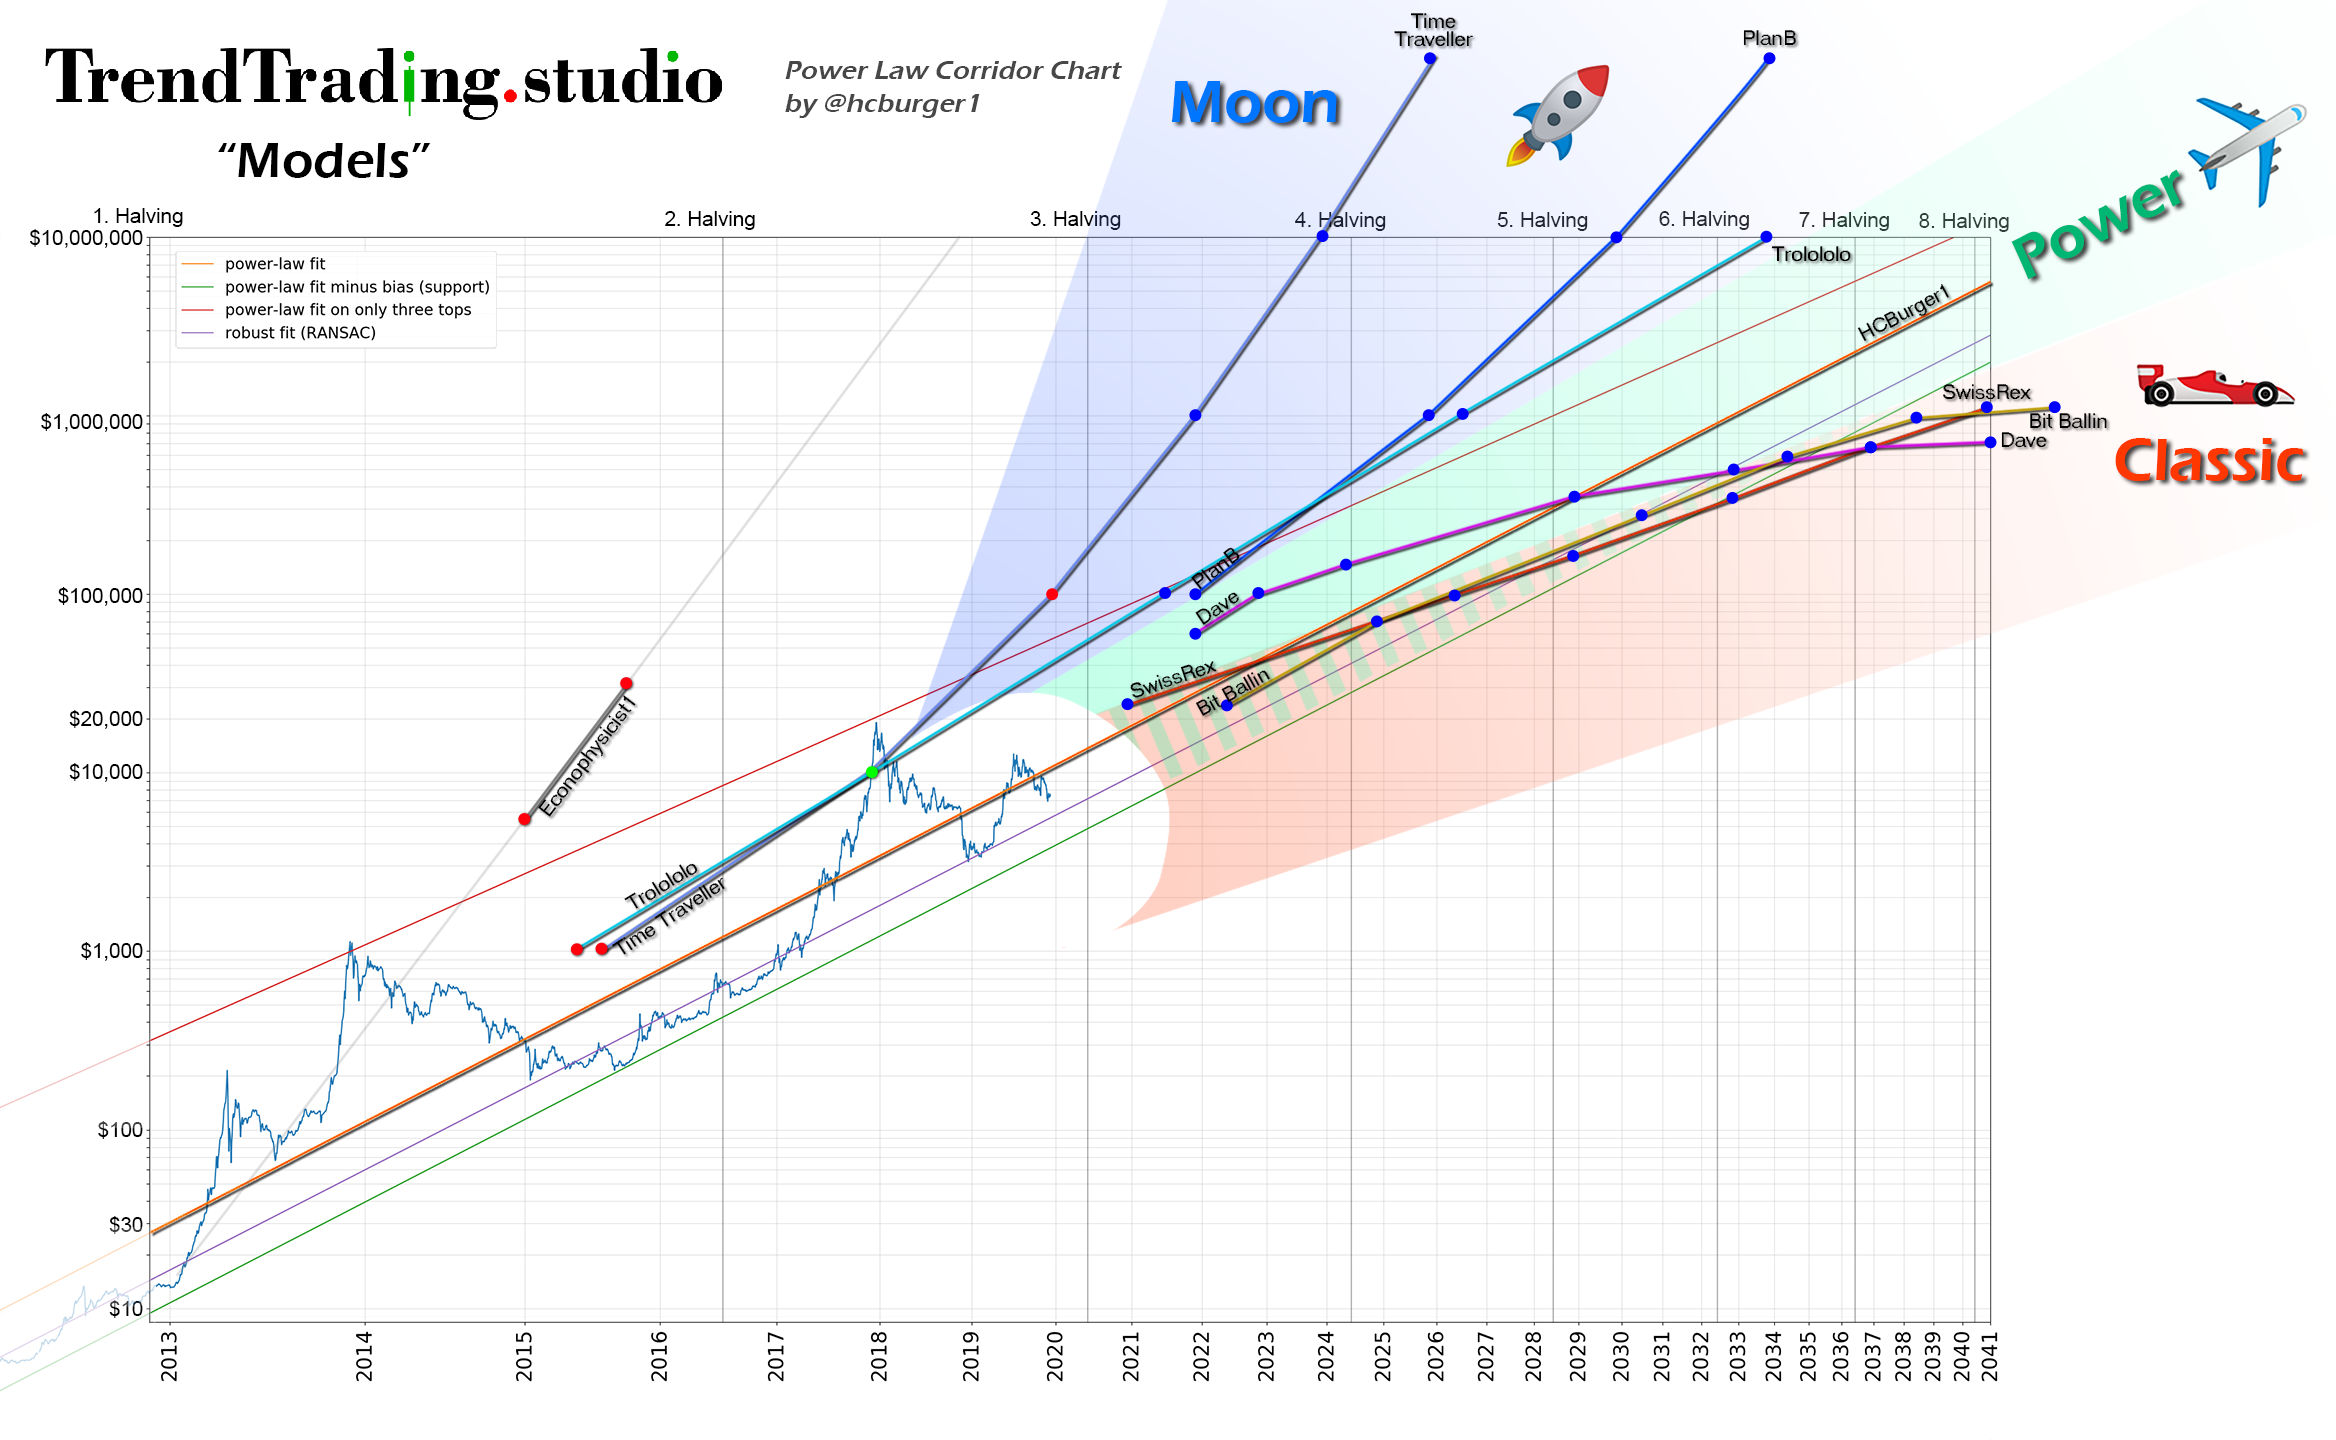
There are 3 types of BTC price models:
Moon models assume that Bitcoin grows at the same pace.
Power models state that Bitcoin keeps growing with the same decreasing speed.
Classic models imply that Bitcoin's growth decreases even faster than in the past.
Moon models:
Time Traveller (TT model), PlanB @100trillionUSD (S2F model)
Power models:
econophysicist1 @gsantostasi (LM & PLM models), Trolololo (TL model), @hcburger1 (PLC model), @InTheLoopBTC (RGR model)
Classic models:
@SwissRexAG (SR model), @davthewave (DTW model), @BitBallin (QM model)
Power (law) models project declining past BTC growth most accurately into the future. @gsantostasi's LM did it in early 2014, but failed due to limited data. Trolololo from Oct 2014 might be too optimistic too, because it was so early. Newer models have a lower trajectory.
There is a lot of overlap between power & classic models presently. If power models correct again in future, they come close to classic models. Classic models are still quite bullish, even with more conservative predictions. They make BTC again the best investment of the decade.
Moon models freeze the declining BTC growth rate at one point in time and assume constant growth in future. This contradicts price history. The TT model froze growth in 2015, S2F does it with the next halving. TT has almost failed. The next 2-6 years will show if S2F survives.
More on Bitcoin's diminishing growth in this article by Chris Burger.